Why My 4-Bit CUDA
Kernel Wasn't Faster
Making the data smaller is a different problem from making the machine read it well.
A neural network is mostly a huge grid of numbers called weights. Using one means multiplying your input through that grid, layer after layer.
I wanted to optimize one matrix multiplied by one vector. Most of the time in that operation goes to moving weights out of memory and into the arithmetic units, so the lever available to increase performance is to make the weights smaller. I shrank them and measured what happened.
Quantization means storing numbers less precisely on purpose. You lose a little accuracy in every weight, and in return there’s far less data to move.
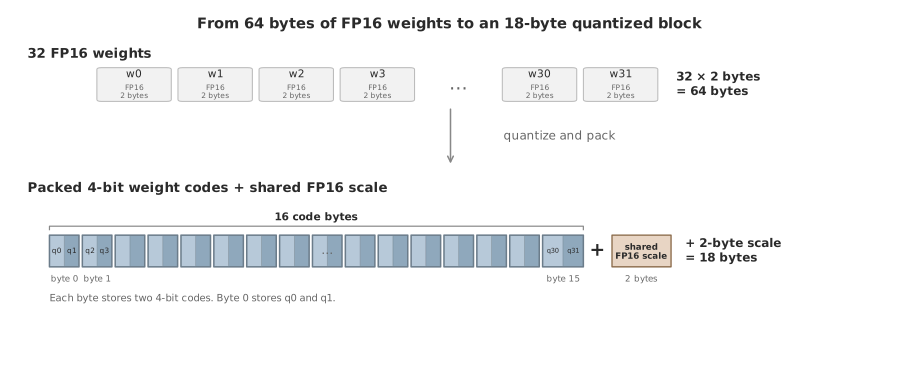
My baseline stored each weight in 16 bits, two bytes, in a format called FP16. I stored each weight in 4 bits instead, which puts it in the family of formats called Q4. A group of 32 weights that used to take 64 bytes now took 18: 16 bytes of codes plus a 2-byte scale that the 32 weights share.
The program that does the multiplying on a GPU is called a kernel. I wrote one that reads the 4 bit weights from memory, and I expected it to be faster because it had fewer bytes to read.
I didn’t expect 3.56x faster, since decoding has overhead, but 2x seemed plausible. I picked the scheme, wrote a straightforward C++ version to check the CUDA output against, wrote the CUDA kernel, and wrote the tests.
I could already imagine the blog post.
Then I ran the benchmark, on a 16,384 x 16,384 weight matrix (2^14).
Baseline FP16: 320.3 microseconds.
Quantized Q4: 312.1.
I had compressed the weights to less than a third of their original size and saved a full eight microseconds.
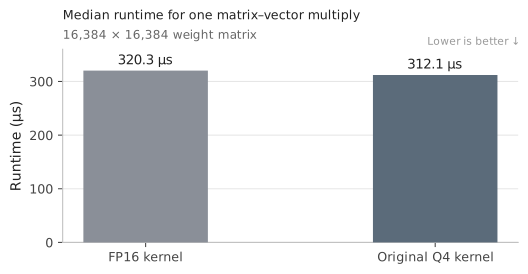
I ran it again. Then I checked the correctness again. Same numbers, tests still passing.
Damn.
Plenty of people run quantized models on their own machines, so the technique clearly works. If the speedup wasn’t there, it was something about my implementation.
I wanted to learn GPU programming. I also work in public because it makes me accountable to other people. If the only output is my own understanding, I can tell myself I understood it. But if I wrote something it has to hold up for someone else reading it, and ideally teach them something.
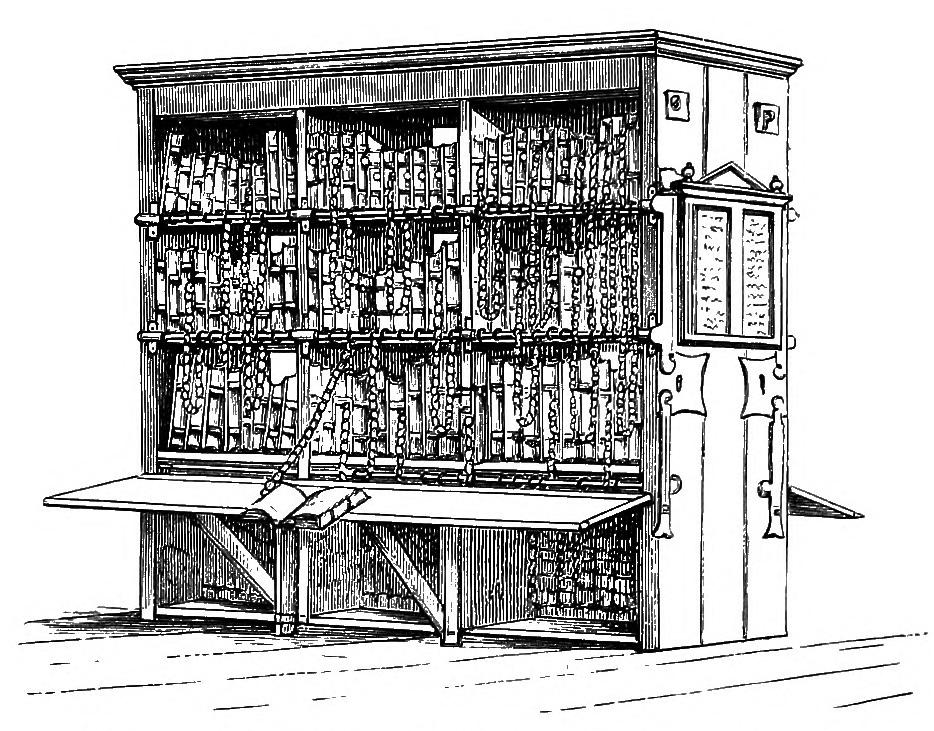
For centuries libraries bolted their valuable books to the shelves, on chains long enough to read at a desk but not long enough to carry home. Printing ended it, not any change of heart. Copies got cheap enough that guarding them stopped being worth the trouble.
A 70B model at 16-bits needs 140GB of memory. No GPU you can buy holds that much, so you need to rent access to someone else’s. At 4 bits it needs 40GB, which two consumer cards will do, or a Mac with enough unified memory. Once it fits on hardware you own, nobody has to let you use it.
I worked on my quantization kernel at night, mostly, and sometimes early mornings. A lot of it happened with the laptop on the floor, next to a sleeping baby.
Why fewer bytes should have helped
The operation I tried to optimize is y = Mx. M is the weight matrix, x is the input vector, and y is the output. For every row of M, the kernel multiplies each weight by the matching value in x and adds up the results, which produces one number in y.
I’d been thinking about it as arithmetic, but on the GPU it mostly isn’t. Each weight gets read once, multiplied once, and never touched again, so the time goes almost entirely into fetching and the multiply rides along behind it. It should be limited by memory bandwidth rather than by the arithmetic operations. Fewer bytes should have helped.
Four bits can’t hold a float. Nothing in that bottom row is a weight. The kernel builds each one on the way in: pull the code, subtract the bias, multiply by the scale.
Where the time went
I started with correctness, since I already had the tests for it. I wrote a simple C++ implementation to check against and the Q4 output matched. The kernel was correct but it was slow.
After that I was mostly lost so I changed the matrix size, which was the nearest knob I could reach.
I wasn’t thinking about cache at all yet.
My kernel plateaued around 480 GB/s of effective bandwidth no matter what size I gave it. The FP16 kernel managed around 1,680 GB/s.
I rented a GPU, and I’d terminate it whenever I wasn’t using it, which meant every session started the same way: bring the instance up, wait fifteen minutes for the Docker image to load, run the same list of commands once I could ssh in, and hope none of that went wrong, because sometimes the image never finished loading and just sat there looping, and sometimes ssh wouldn’t forward, and the fastest fix either way was to kill it and rent a different GPU and start the fifteen minutes over. Then boot, run, scp the data off as fast as I could, shut it down. If my baby woke up and started crying, that was the end of my session. Terminate the instance, close the laptop. Everything could be re-run.
I looked forward to those boot-ups more than I expected to. Fifteen minutes of nothing, then a burst of activity, and a chance at finding something I hadn’t known that morning. An hour straight was about the most I ever got. This went on for the better part of a month.
1,676 GB/s against my 484 is about 3.5. My format was 3.56x smaller. The two cancelled almost exactly, which is a great deal of effort to break even.
There are my eight microseconds.
It also wasn’t a clean experiment. The matrices were square, so every step up changed several things at once like the number of output rows and the work inside each row.
So I did it again properly, by varying one dimension at a time. Matrices with the same number of weights came in at nearly the same time regardless of their shape.
That told me which variable mattered: not the shape, just the byte count.
Q4 didn’t catch up to FP16 until the FP16 weights hit about 128 MiB: 80.96 microseconds against 82.69.
A GPU keeps a pool of fast memory on the chip itself, called L2, and anything it holds gets served from a few millimeters away instead of from the memory chips out on the board. If the weights fit, it skips the trips to DRAM, and fewer bytes is less important.
The card I rented was an RTX 5090, which has 96 MiB of L2. So I went looking for a shape where both formats fit inside it. At 8,192 x 4,096 the FP16 weights come to 64 MiB and my quantized version to 18 MiB, neither making the round trip to DRAM.
FP16 ran it in 13.47 microseconds. Mine took 42.05.
Reading 3.56x fewer bytes, with everything already in cache, my kernel was still 3.1x slower. If the trip out to DRAM isn’t the constraint and the gap is still this large, what’s left? Something in the kernel.
Loading the same bytes differently
The first kernel mirrored my format. A packed byte came in as a uint8_t (8 bits). An input value was defined as a __half (16 bits). I only quantized the weights, so x stays in FP16. The types were semantic: they said what the values meant. Sixteen code bytes in a block meant sixteen byte loads.
I had an inkling that a GPU would rather do more per instruction. So I went looking through the docs for the widest read I could find.
Before I’d half-assumed the compiler or the cache would paper over the narrow reads. The compiler could merge them, or the first read could drag its neighbors into cache and the next fifteen would be nearly free. I thought either way the width I wrote in the source wouldn’t matter much. It did.
Reading my code again, I noticed how it divides the work. Each thread owns a different block, 16 bytes apart, and the GPU runs 32 threads in lockstep. So one load reaches across 512 bytes of memory and comes back with 32 bytes of it.
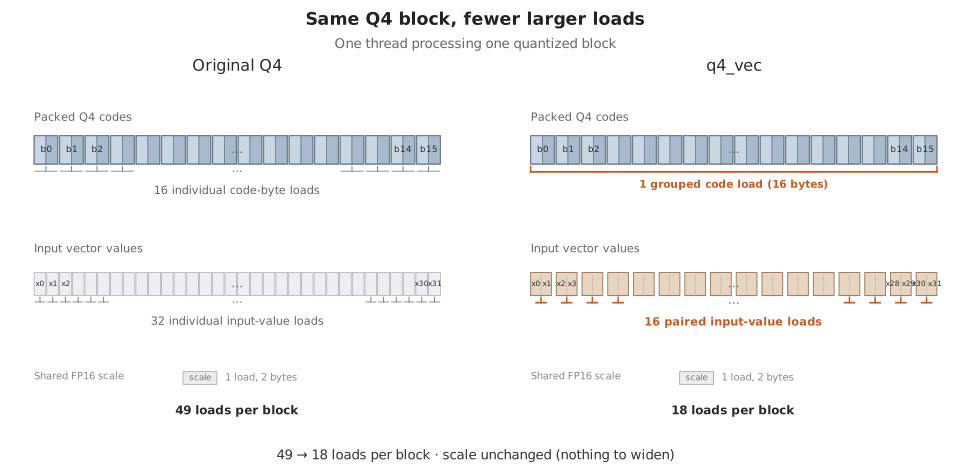
I started picking types for transport rather than semantics. CUDA has a vector type called uint4 (128 bits), wide enough to bring a block’s packed codes as one load instead of sixteen. The input vector went from one value at a time to half2 (32 bits), two at a time.
The original inner loop runs once per code byte. Each pass reads the byte, then reads the two input values it needs. That’s three loads, sixteen times, plus the scale: 49.
// 1 load, 16 bits
const float scale = fp16_bits_to_float(row_scales[qblock_idx]);

// 16 iterations
for (int byte_idx = 0; byte_idx < 16; ++byte_idx) {
    // 1 load, 8 bits
    uint8_t byte = qblock_codes[byte_idx];
    // unpack both nibbles, subtract the bias
    // 1 load, 16 bits
    float x0 = __half2float(x[weight_idx]);
    // 1 load, 16 bits
    float x1 = __half2float(x[weight_idx + 1]);
    unscaled_dot += code_lo * x0 + code_hi * x1;
}
The vectorized kernel pulls all 16 code bytes in before the loop, in one 128-bit load. The loop still runs 16 times and computes the same product, but the only thing it loads now is the input values, two at a time.
// 1 load, 16 bits
const float scale = fp16_bits_to_float(row_scales[qblock_idx]);

// 1 load, 128 bits: every code byte in the block
const uint4 packed = *reinterpret_cast<const uint4*>(
    row_codes + qblock_idx * CODE_BYTES_PER_QBLOCK);

// 16 iterations
for (int j = 0; j < 16; ++j) {
    // pull byte j out of packed, unpack both nibbles, subtract the bias
    // 1 load, 32 bits
    const __half2 x_pair = *reinterpret_cast<const __half2*>(&x[weight_idx]);
    const float2 xf = __half22float2(x_pair);
    unscaled_dot += code_lo * xf.x + code_hi * xf.y;
}
Two casts! That’s the whole change. The kernel reads the same bytes and computes the same product, but it now asks for them in fewer, wider requests: 18 loads per block instead of 49.
Each one costs an instruction slot and a request, whether that request is for one byte or sixteen.
I finally got results
At 16,384 x 16,384 the vectorized kernel took 144.3 microseconds, 2.22x faster than FP16.
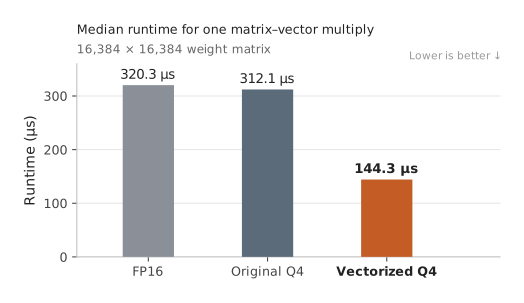
My kernel went from 484 GB/s to about 1,050. A plain device-to-device copy on this GPU measures 1,264, so that’s most of what the hardware can do.
This was one of the rare midday sessions, during my baby’s nap. I sat with it for a minute, then shut the instance down like every other session.
What the compiler actually did
Later sessions went into trying to falsify the result, and reading the compiled assembly was the main way I went about it. I hadn’t done this in years. You don’t often get an excuse to. cuobjdump -sass prints the exact instructions the compiler produced. I ran it on the benchmark binary.
I had several ideas about where the 2x came from. Maybe the compiled body had gotten smaller. Or the contiguous addressing mattered more than the width.
And a worse possibility. If the compiler had already been merging those adjacent byte loads on its own, both kernels would issue about the same number, my change would be cosmetic, and the 2x came from somewhere I hadn’t looked.
I half expected that.
And… it hadn’t! Per block, the original kernel issued 49 global loads and the vectorized one issued 18.
// original: one code byte, two x values, repeat
LDG.E.U8.CONSTANT   R19, desc[UR6][R8.64+-0x7] // 8 bits
LDG.E.U16.CONSTANT  R27, desc[UR6][R6.64+-0x1e] // 16 bits
LDG.E.U16.CONSTANT  R26, desc[UR6][R6.64+-0x20] // 16 bits
...

// vectorized: the whole block of codes, then paired x values

LDG.E.128.CONSTANT  R4,  desc[UR6][R12.64] // 128 bits
LDG.E.CONSTANT      R32, desc[UR6][R10.64+-0x20] // 32 bits
LDG.E.CONSTANT      R31, desc[UR6][R10.64+-0x1c] // 32 bits
Look at the offsets (the numbers at the end of the addresses). The original steps by 0x2, two bytes, one __half at a time. The vectorized one steps by 0x4, because a __half2 is four bytes.
So the faster kernel executes more instructions. I had that backwards. Counting them doesn’t tell you much anyway, since a global load and a bit shift aren’t the same kind of work. The vectorized code issued more cheap arithmetic operations instead of more expensive load operations.
Reading the machine code showed that the load count went from 49 down to 18 and the reads got wider, which the offsets demonstrated.
I read NVIDIA’s profiling guide later. Their advice for a warp stalled on the local/global memory queue is to “combine multiple lower-width memory operations into fewer wider ones,” which is exactly the change I made.
The codes are 16 bytes, so widening them to uint4 also made the warp’s 32 requests contiguous as well.
Then I widened the other half
16 of the 18 loads per block were still fetching x, two values at a time. Widening those to uint4 cut them to 4, taking the total from 18 to 6.
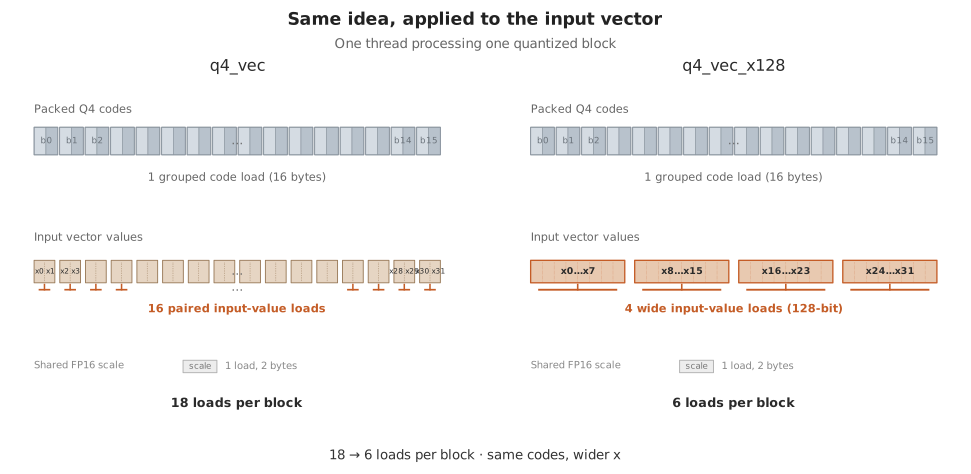
I guessed it would be worth about another 1x. Call it 3.2x over FP16.
It came out at 3.45x. 144.3 microseconds down to 93.0.
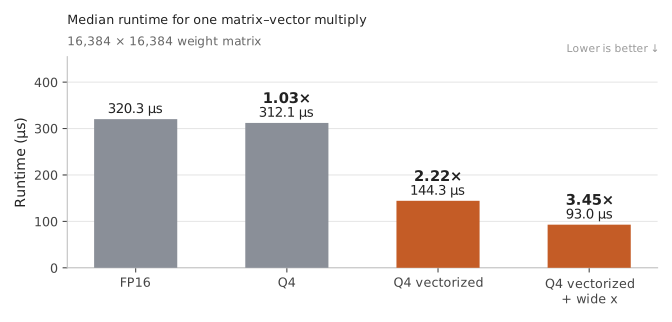
144 MiB is only just past the 96 MiB of L2, and that boundary mattered before, so I wanted to rule it out. I ran it at 32,768 x 32,768, where the weights are 576 MiB and would definitely not fit in L2 cache. Same improvement.
My latest kernel beat FP16 at every size I tried. 3.45x against a format that’s 3.56x smaller. Not much room left there. The kernel moves a calculated 1,624 GB/s. The GPU is rated for 1,792.
I started out believing the central optimization was the representation. That was only the first half. Then the implementation that runs on the GPU decides the rest.
What I’d try next isn’t another cast. The fast Q4 kernels split rows across warps and keep x in shared memory, and that’s a rewrite for another day.
The code is on GitHub.